K-AQUASWater GIS Intelligence
WatershedPollutionPriority


DroMii connects drone, satellite, GIS, and public datasets into operational workspaces that help teams understand infrastructure conditions and prioritize action.
Map-based exploration, AI analysis, layer comparison, and visual reporting are combined into one workflow to reduce repetitive review work.
Unify satellite, drone, public, and field data as GIS layers.
Transform pollution sources, road damage, and change signals into actionable indicators.
Review results through maps, layers, and comparison views.
Identify priority areas, risky segments, and next actions.
Different infrastructure problems, solved through the same data, AI, and GIS operating model.

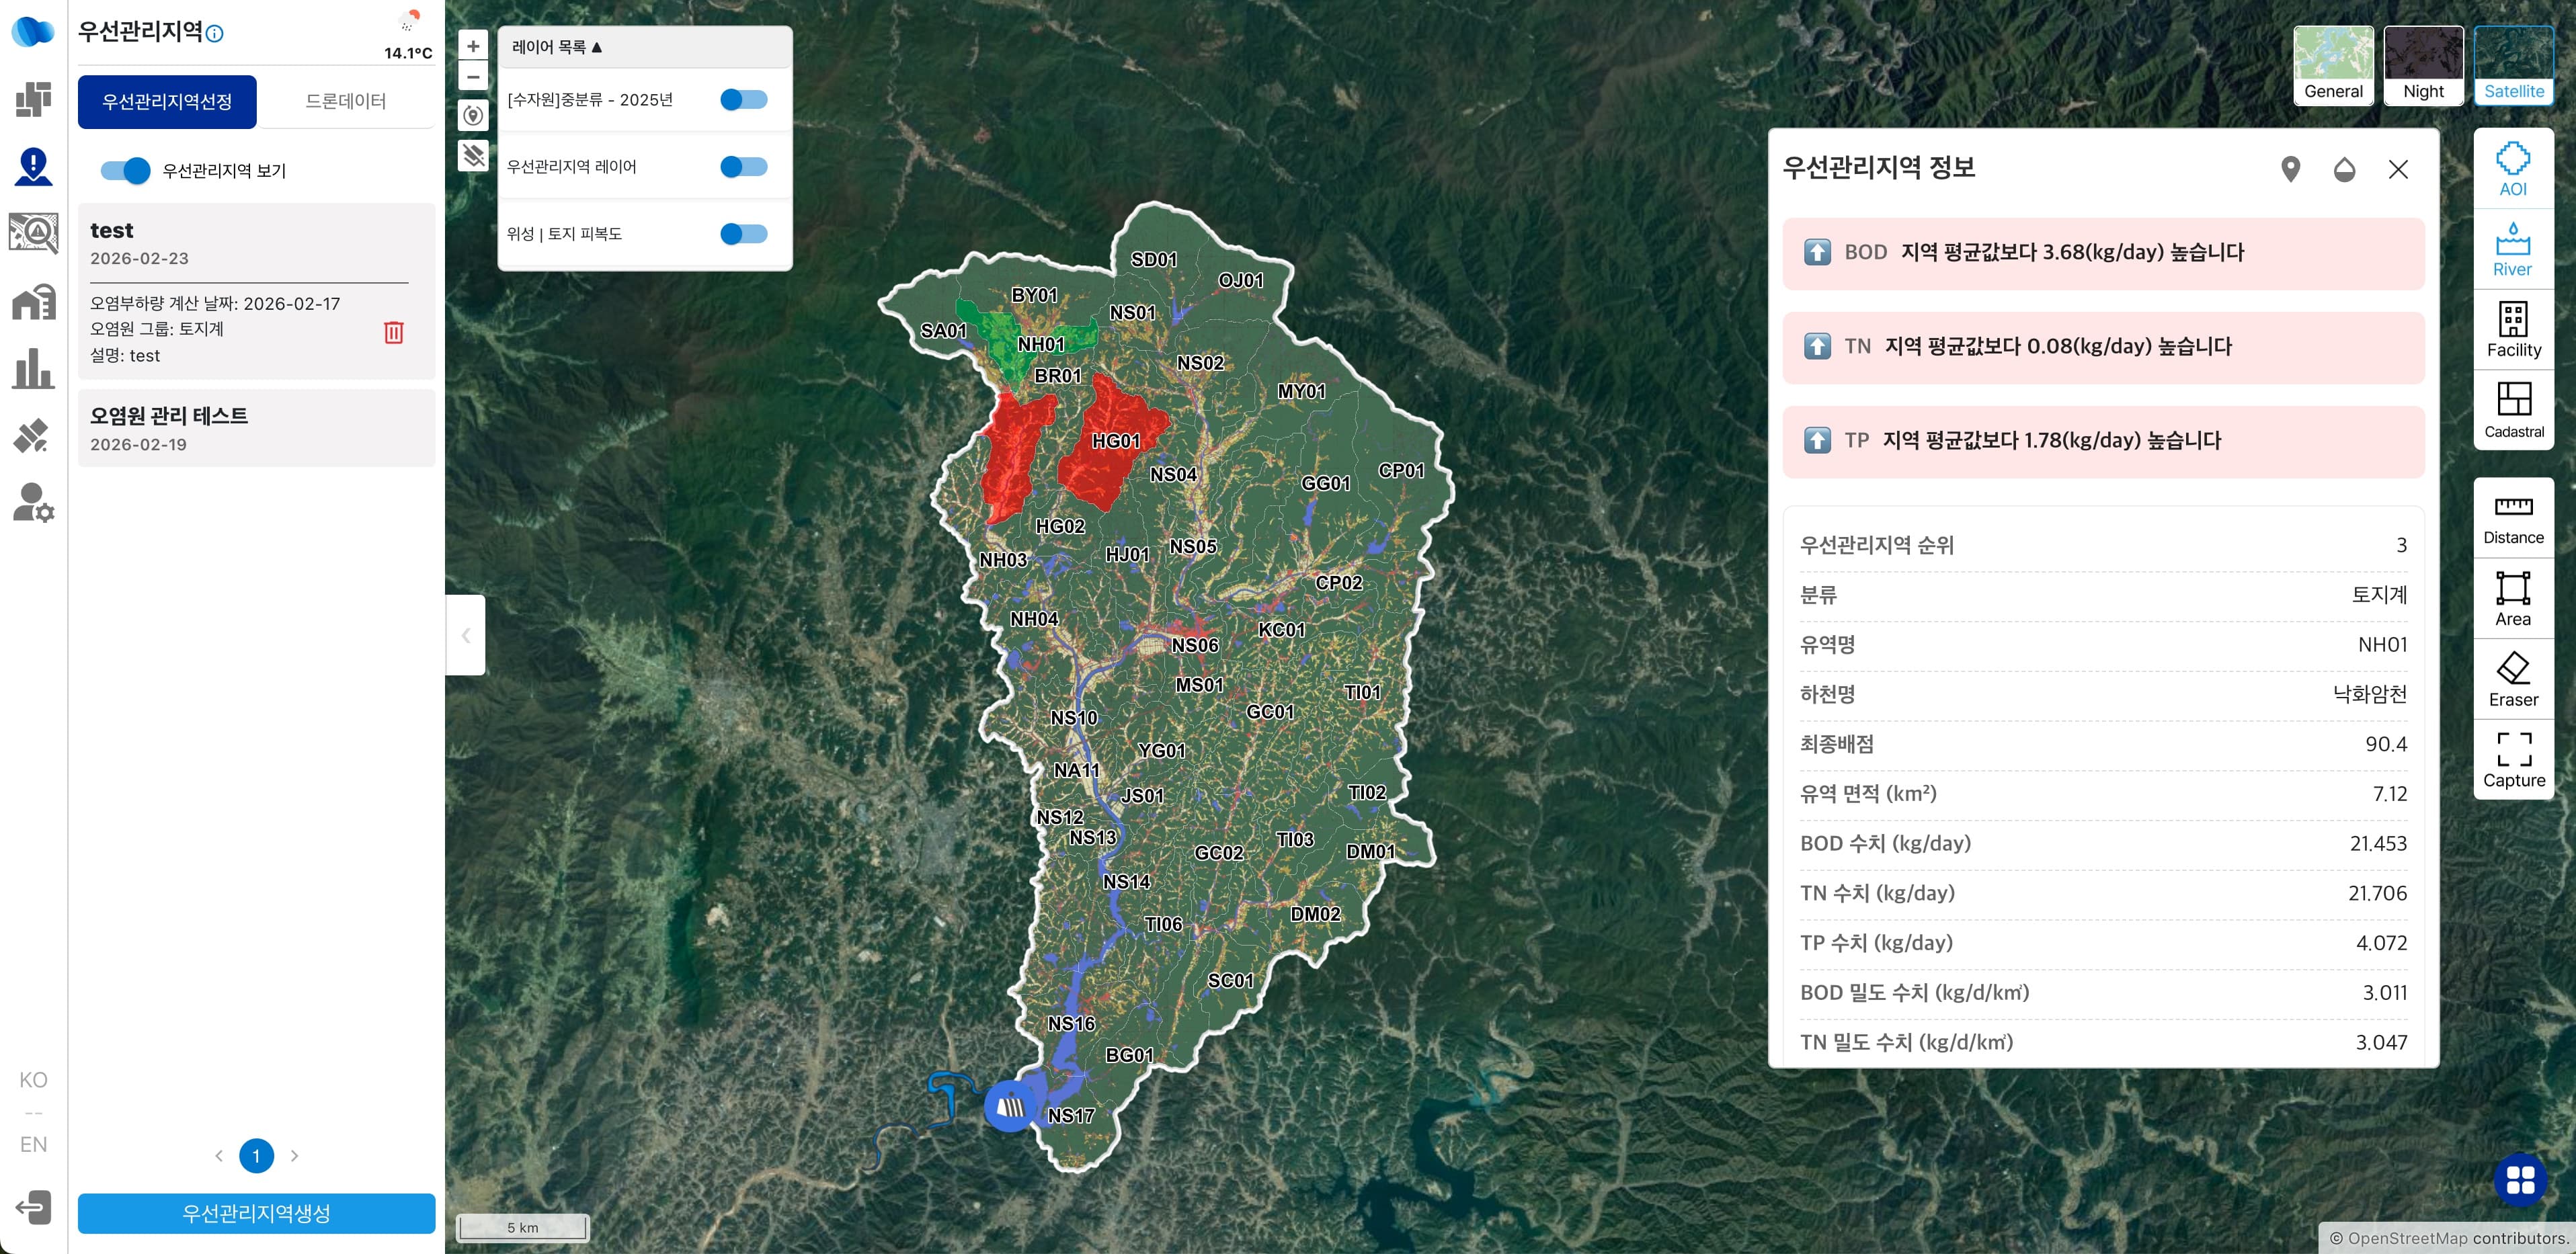
K-AQUAS integrates satellite imagery, land-cover maps, water quality indicators, and pollution source data around dams and watersheds so managers can identify changes and risks faster.
Dam/weir map, AOI, river, facility, and cadastral layers
NDVI/NDWI, land cover, water quality layers, pollution load
Land-cover comparison, pollution projects, priority areas

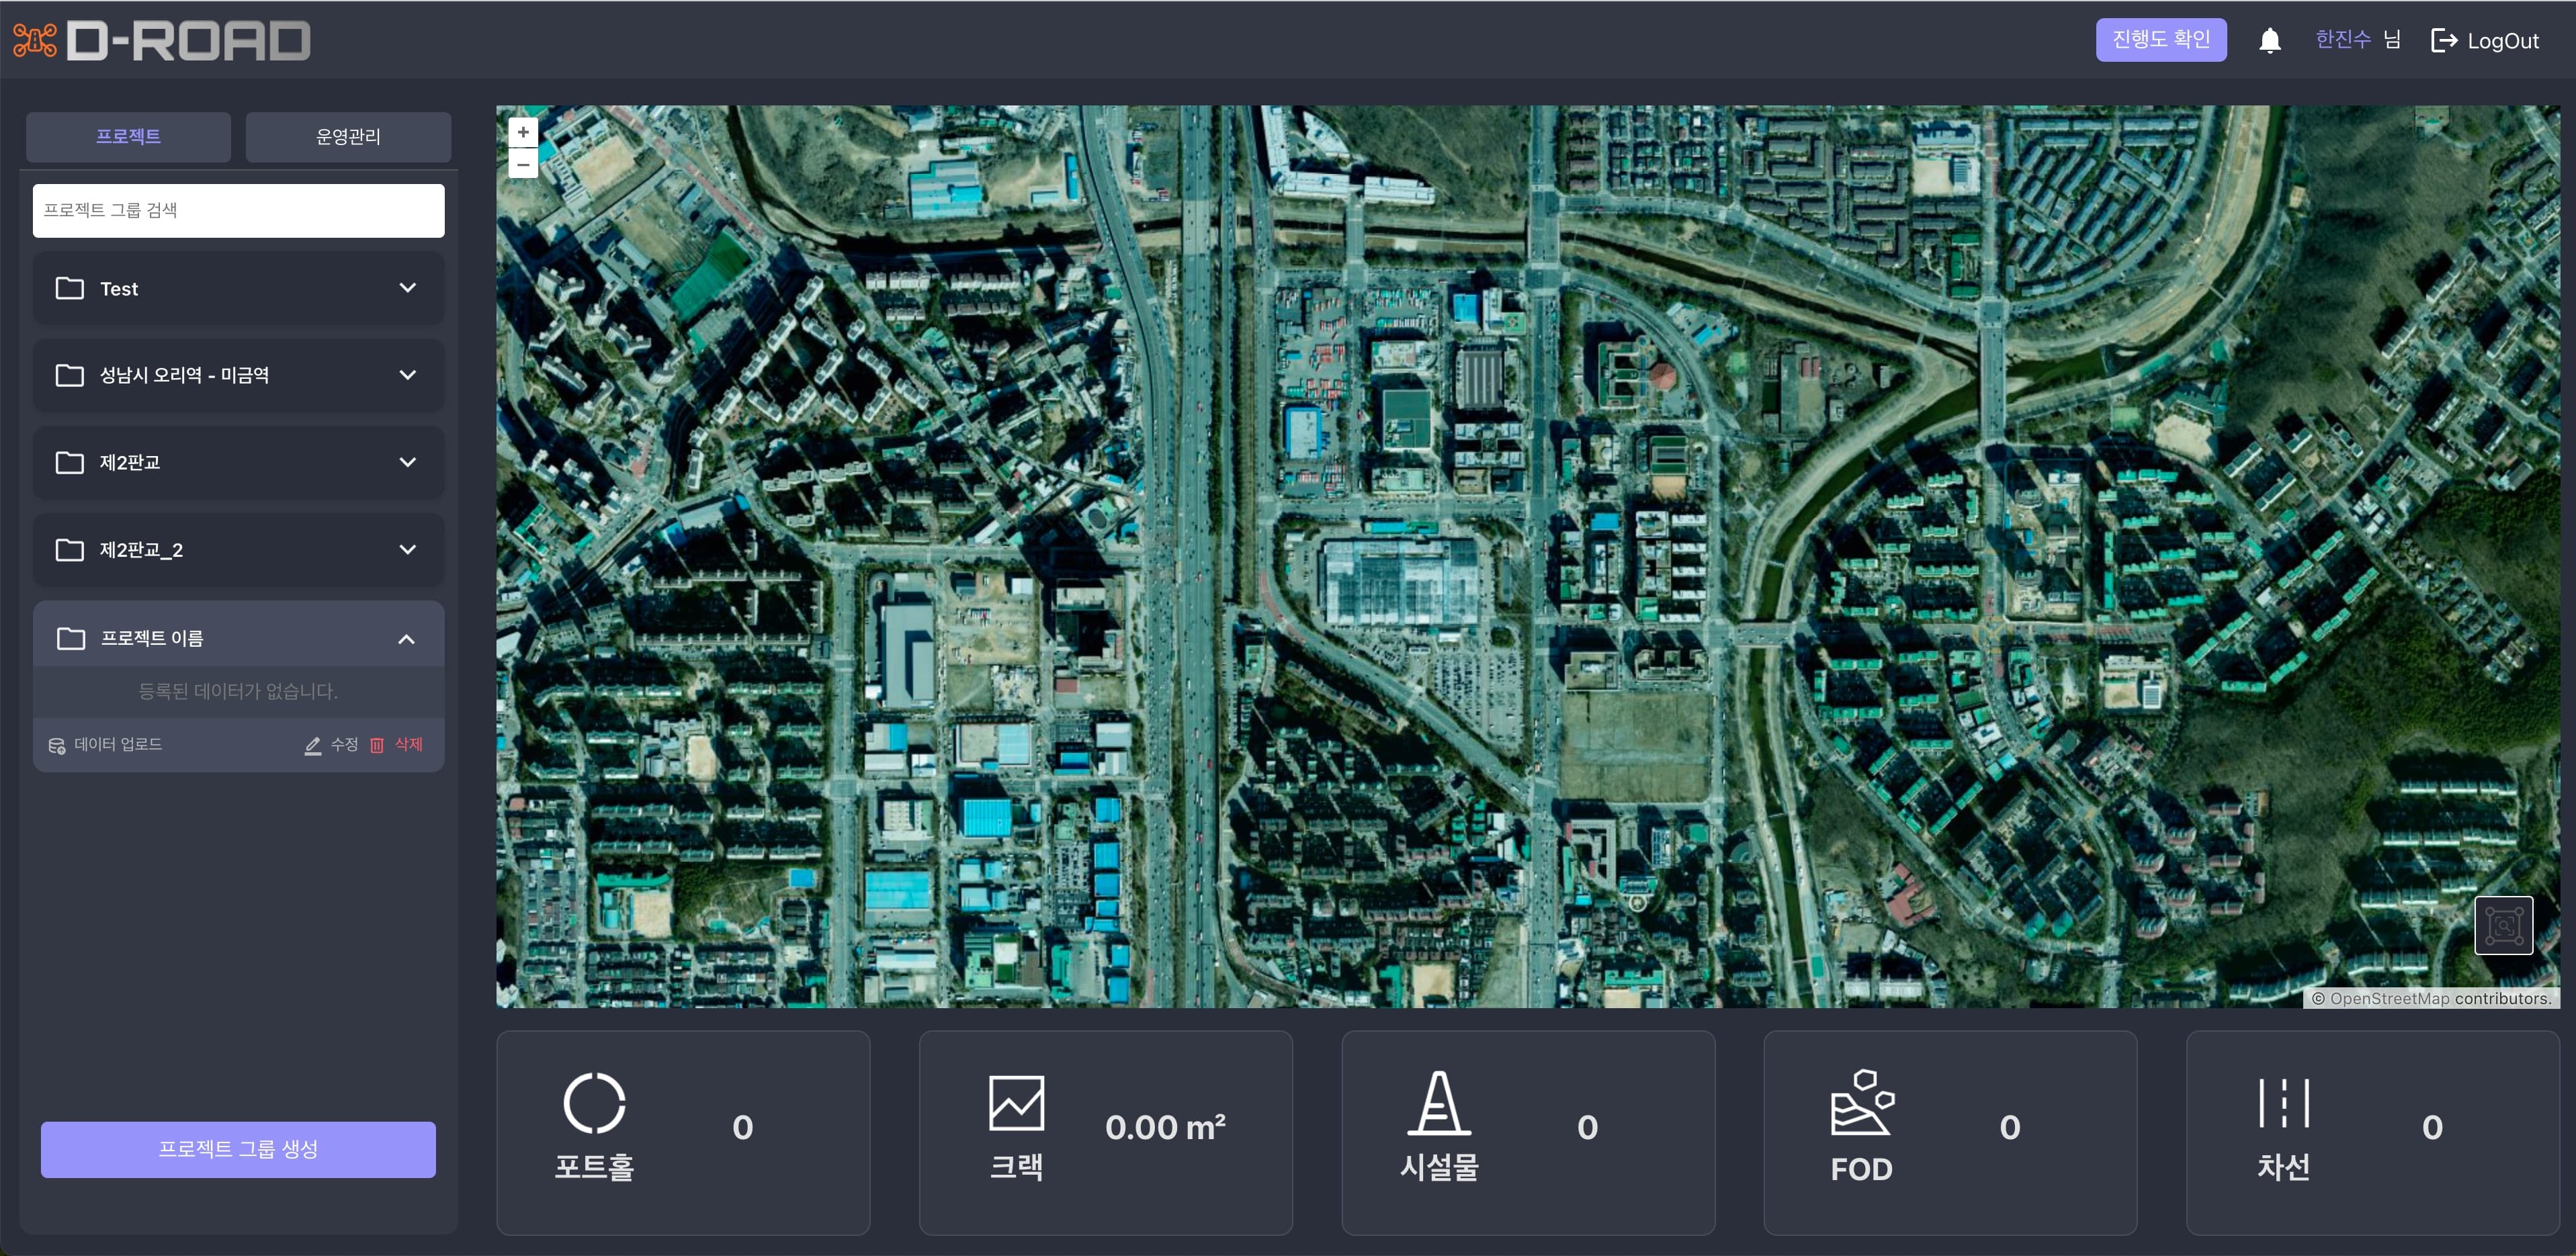
D-ROAD analyzes road imagery and spatial data with AI to detect potholes, cracks, and risk factors while helping maintenance teams organize repair priorities.
Road segments, location-based risks, field images
Potholes, cracks, pavement issues, facility risk signals
Inspection visualization, repair priorities, management reports
Use the live demos and existing detail pages to review the product flow before deeper implementation.